- LineStar MLB DFS & Prop Bets
- Posts
- Rounding the Bases | LineStar’s 2026 MLB DFS Primer & Strategy Guide ⚾
Rounding the Bases | LineStar’s 2026 MLB DFS Primer & Strategy Guide ⚾
It's Time to Prepare for the 2026 MLB Season!
Ryan Humphries
March 18, 2026

Welcome back for another MLB season!
We’re officially one week out, with Opening Night set for Wednesday, March 25th, featuring a single-game showdown between the Yankees and Giants broadcasted by Netflix. Then comes the main event on Thursday, March 26th, when 22 teams take the field for their first game of the year, and the season really gets rolling.
Before we get into it, a quick tip of the cap to Venezuela for taking home the 2026 World Baseball Classic title over the USA. A scrappy roster, clutch performances, and a well-earned Venezuelan championship run created a fun reminder of just how strong the global game has become. It would’ve been nice to see some of that moxie from the uber-talented American roster, but the spark just wasn’t there!
As for MLB DFS, it’s that time again.
If late-season NBA DFS has been wearing you down, or you’ve been missing the structure of NFL DFS, this is where things reset. MLB DFS brings a different rhythm – larger slates, daily variance, and a long season that rewards patience and consistency.
Here at LineStar, the goal is the same as always – to help put you in the best position to succeed. This guide is designed to get you ready for the 2026 season, whether you’re jumping in fresh or just need a refresher on how to approach MLB DFS with a sharper edge.
Whether you’re a casual player building a lineup or two or someone max-entering tournaments on a nightly basis, it never hurts to knock the rust off and revisit the fundamentals. Feel free to bookmark this guide for future reference, though it will be linked throughout the season at the top of our daily newsletters.
Fair warning – this is a long read (and may be clipped in email form). But if you’re looking to tighten up your process or gain an edge, it’s well worth the time.
Welcome back to baseball. Let’s have a profitable season!

For the 2026 MLB season, I’m thrilled to once again have the honor of writing the LineStar Daily Ledger newsletters for the eighth consecutive year. LineStar subscribers can expect an MLB newsletter for every main slate, Monday through Friday. These will be delivered straight to your email inbox and simultaneously linked at the top of the projections page on both the app and desktop site. Typically, newsletters will be sent out and posted around 3–4 PM ET – roughly three to four hours before the slate begins.
My main goal with these newsletters is to provide a reliable, easily digestible daily introduction to every main slate. This includes covering Vegas spreads and implied team totals, highlighting potential weather concerns, touching on major MLB news, trades, or injuries when relevant, and, of course, the ‘meat’ of each newsletter will be centered around spotlighting some of the slate’s top pitchers, team stacks, one-off hitters, and value plays that I find most appealing or intriguing.
We’ll also mix in some fun extras, like some prop pick suggestions and the Home Run Calls of the Day from myself, Tyler Wiemann, and other guest pickers! The “Home Run Calls of the Day” contest will run daily (Monday–Friday) on the LineStar Twitter/X. Anyone who retweets the post will have a chance to win some great prizes – so be sure to follow along!
Tyler will also be recording daily YouTube videos – including a DFS overview as well as some player props. These will be linked in the newsletter, but I highly recommend subscribing to the LineStar YouTube channel so you never miss the latest content.
If you have any suggestions for additions or changes to the newsletters, or if you have any general questions or concerns, feel free to tag me in the LineStar chat or reach out to me anytime on Twitter/X @Ryan_Humphries!
📝 General MLB Strategy
For anyone new to MLB DFS, the first thing to understand is that baseball is easily the most volatile of the major DFS sports. You can line up an elite hitter in a perfect matchup against a weak pitcher in a hitter-friendly park and still get an 0-for-4 goose egg. On the flip side, a random Triple-A call-up hitting near the bottom of the order can go off for multiple hits, a home run, and a big fantasy score against a top-tier arm.
That’s just the nature of baseball. Even the best hitters in the world fail the majority of the time. Variance is unavoidable, and it will test your patience over the course of the season. There will be stretches where nothing seems to click. That doesn’t necessarily mean you’re doing anything wrong.
The MLB season is a 162-game grind, and MLB DFS is no different. No one is profitable every day, and chasing short-term results is a quick way to burn through your bankroll.
With that in mind, bankroll management is critical if you’re approaching DFS with a long-term ROI mindset. A good rule of thumb is to allocate around 5–15% of your bankroll to each slate. If you’re not keeping a set DFS bankroll loaded into your account, think of that as 5–15% of what you’re comfortable playing with over a given month.
Early in the season, it’s best to stay on the conservative side of that range. We’re still learning who players are in 2026. Year-to-year performance can shift for a variety of reasons – new teams, different ballparks, lingering injuries, offseason adjustments, and more. For the first couple of weeks, we’re leaning heavily on prior-year data while slowly incorporating current-season results.
It typically takes a few weeks before things start to stabilize. For hitters, I’m generally looking for around 20 games and 60–80 at-bats before putting real weight on current-season numbers. For pitchers, that sample can come along a little slower depending on how many off days they receive between starts – I generally wait roughly four to five starts and 25–30 innings before I begin drawing more serious conclusions.
Another key component of MLB DFS is staying active as lock approaches. Lineups are released well in advance compared to other sports, but there’s still plenty of movement to monitor. Batting order changes, rest days, and late scratches can all shift the slate.
Those situations can also create opportunity. A cheap hitter moving into a top-of-the-order role could often be one of the best sources of value on a slate. Both DraftKings and FanDuel offer late swap, which helps protect you from unexpected news, but only if you’re paying attention.
🔀 Late Swap Strategy
MLB DFS is one of the best formats to take advantage of late swap, especially with staggered start times across slates. Staying active after lock can give you a meaningful edge.
If your early players underperform, consider pivoting to lower-owned, higher-upside plays in the later games to make up ground. On the flip side, if your lineup gets off to a strong start, you can lean into safer or higher-owned options to protect your position.
Weather updates, lineup changes, and ownership projections all play a role here – staying engaged throughout the slate can pay off.
Also, as a general rule of thumb, be aware of the MLB scoring system for your preferred DFS site!


DraftKings MLB DFS Scoring


FanDuel MLB DFS Scoring


Yahoo MLB DFS Scoring
💰 Cash Game Strategy
Before diving in, it’s worth noting that there’s no one-size-fits-all approach to DFS – especially in MLB. Not everyone will agree with every aspect of this strategy, and that’s perfectly fine. This is simply the approach I’ve developed over the years through plenty of trial and error.
On most MLB slates, I allocate a larger portion of my bankroll to cash games (double-ups, triple-ups, head-to-heads, and 50/50s) than to GPPs. Typically, that falls in the 60–70% range for cash contests, with the remaining 30–40% going toward tournaments. That said, there are plenty of slates where I’ll lean fully into GPPs if the structure or game environments call for it.
While chasing a massive tournament score is always appealing, it’s not something you can rely on consistently. My focus is long-term ROI – building around players in strong, logical spots rather than depending too heavily on low-probability, high-variance outcomes. That doesn’t mean ignoring GPP leverage entirely, but in a sport driven by volume and opportunity like baseball, I prefer to anchor most of my exposure around plays that project well. The LineStar MLB Daily Ledger newsletters will generally reflect that approach, while still pointing out viable contrarian options when they make sense.
A common strategy for cash games across all DFS sports is to focus on building one strong, high-floor lineup specifically for cash contests. I follow the same process in MLB. In most cash formats, especially larger-field 50/50s, ownership shouldn’t be a concern. Eating chalk is not only acceptable, it’s often optimal. If a highly owned player underperforms, it doesn’t hurt you nearly as much. But if you fade that player for a low-owned alternative who busts, you’re immediately playing from behind.
When constructing cash lineups on standard slates (six or more games), I generally prioritize one-off hitters and mini-stacks of two to three players. The focus is on hitters in strong matchups who are batting near the top of the order. I rarely go with full four or five-man stacks in cash unless a team is in an elite spot – think Coors Field or a clearly exploitable pitching matchup.
One final note – always consider entering your cash lineup into at least one GPP, even if it’s a small buy-in. Over the course of a long season, there will be nights where your “safe” lineup ends up being one of the highest-scoring builds on the slate. It happens more often than you’d think, and when it does, you’ll want at least some exposure to that upside.
🔢 Batting Order Importance
This is probably obvious to most, but worth mentioning for any novice MLB DFS players. A hitter’s spot in the batting order plays a major role in their DFS value. Players hitting at the top of the lineup (1–2 spots) will see more plate appearances, which directly translates to more opportunities for fantasy points.
On average, hitters near the top of the order can see one additional plate appearance per game compared to hitters batting toward the bottom. That may not sound like much, but over the course of a slate, it can be the difference between a solid outing and a tournament-winning performance.
When possible, prioritize hitters batting in the top five spots, especially in strong offenses
🥞 GPP Team Stacking & Weather Impacts
Team stacking is one of the most powerful strategies you can deploy when building MLB GPP lineups. For those unfamiliar, “stacking” simply refers to rostering multiple hitters from the same team who bat near each other in the lineup. The goal is to capitalize on a team’s offensive explosion – ideally, your stacked players get on base while others drive them in, creating a chain reaction of fantasy points. A well-executed stack can quickly push your lineup up the leaderboards.
Most DFS players gravitate toward stacking hitters at the top of the lineup (spots 1–5), which makes sense since those are typically a team’s best hitters and are most likely to see the most plate appearances. However, you can differentiate your lineups by incorporating players further down the order – such as a 3–7 stack in a five-man build. Another overlooked approach is the “wraparound stack,” which might include hitters 8, 9, 1, 2, and 3. This can be especially useful on smaller slates where creating unique builds becomes more challenging.
On DraftKings, common stacking formats include:
4-4 stack – Four hitters from two different teams
5-3 stack – Five hitters from one team, three from another
5-1-1-1 – Full five-man team stack with three one-off hitters in strong matchups
4-3-1 or 3-3-2 stack – Mixing multiple stacks, oftentimes with a one-off hitter
2-2-4 stack – Pairing multiple duo-stacks with a more complete four-man team stack
2-2-2-2 stack – A more balanced approach using two-man mini-stacks across four teams
5-2-1 stack – Full five-man stack + mini-stack + one-off
Skipping over a batter in the order is also perfectly fine, especially if you’re targeting platoon advantages (e.g., stacking righties or lefties against a pitcher’s weakness)..
🛣️ Targeting Road Teams for Extra At-Bats
When stacking, road teams can offer a slight edge – especially if you’re including hitters further down the order. Road teams are guaranteed to bat in the 9th inning, while home teams won’t hit in the bottom of the 9th if they’re already ahead.
That extra plate appearance can make a difference in DFS, particularly when stacking multiple hitters who could all benefit from one more trip to the plate late in the game.
That said, this isn’t something to overemphasize. I’m not avoiding home stacks by any means – it’s simply a small edge that can work in your favor when everything else is relatively equal.
📊 Finding Low-Owned Stacks
Being contrarian in GPPs can provide a clear edge. Most DFS players won’t take a chance stacking against elite pitchers like Tarik Skubal or Paul Skenes, but even top-tier arms get shelled from time to time. These “against-the-grain” stacks carry more risk, but they can pay off massively when they hit.
In tournaments, it’s not just about scoring points – it’s about outscoring the field with a unique lineup. Ownership plays a major role in that equation. Highly owned players can still be strong plays, but when they fail, it creates an opportunity to gain significant leverage.
You don’t need to fade all the chalk, but mixing in lower-owned stacks, one-off hitters, or contrarian pitchers in appealing spots is often what separates a min-cash from a top-1% finish.
🤔 Is Stacking a Must in GPPs?
Not necessarily. Plenty of MLB tournaments are won with lineups built around one-off hitters and a couple of mini-stacks. However, if a team puts up 10+ runs in a game, there’s a strong chance that multiple hitters from that lineup will be featured in the optimal GPP-winning build.
🌦️ Weather Considerations
This applies to both GPP and cash games – weather can play a major role in MLB DFS. Certain conditions favor hitters, while others benefit pitchers:
High altitude (e.g., Coors Field, 5,200 feet) – Thinner air = more home runs
Hot & humid weather (e.g., Truist Park in Atlanta during summer) – Baseballs carry farther
Winds blowing out – Increased home run potential
Cool temperatures (40s–50s) & strong winds blowing in – Great pitching environment – even well-struck flyballs can die in the outfield
Rain & storms – Delays or postponements can ruin a lineup
Wind direction matters more than speed alone – 10 mph out > 15 mph across
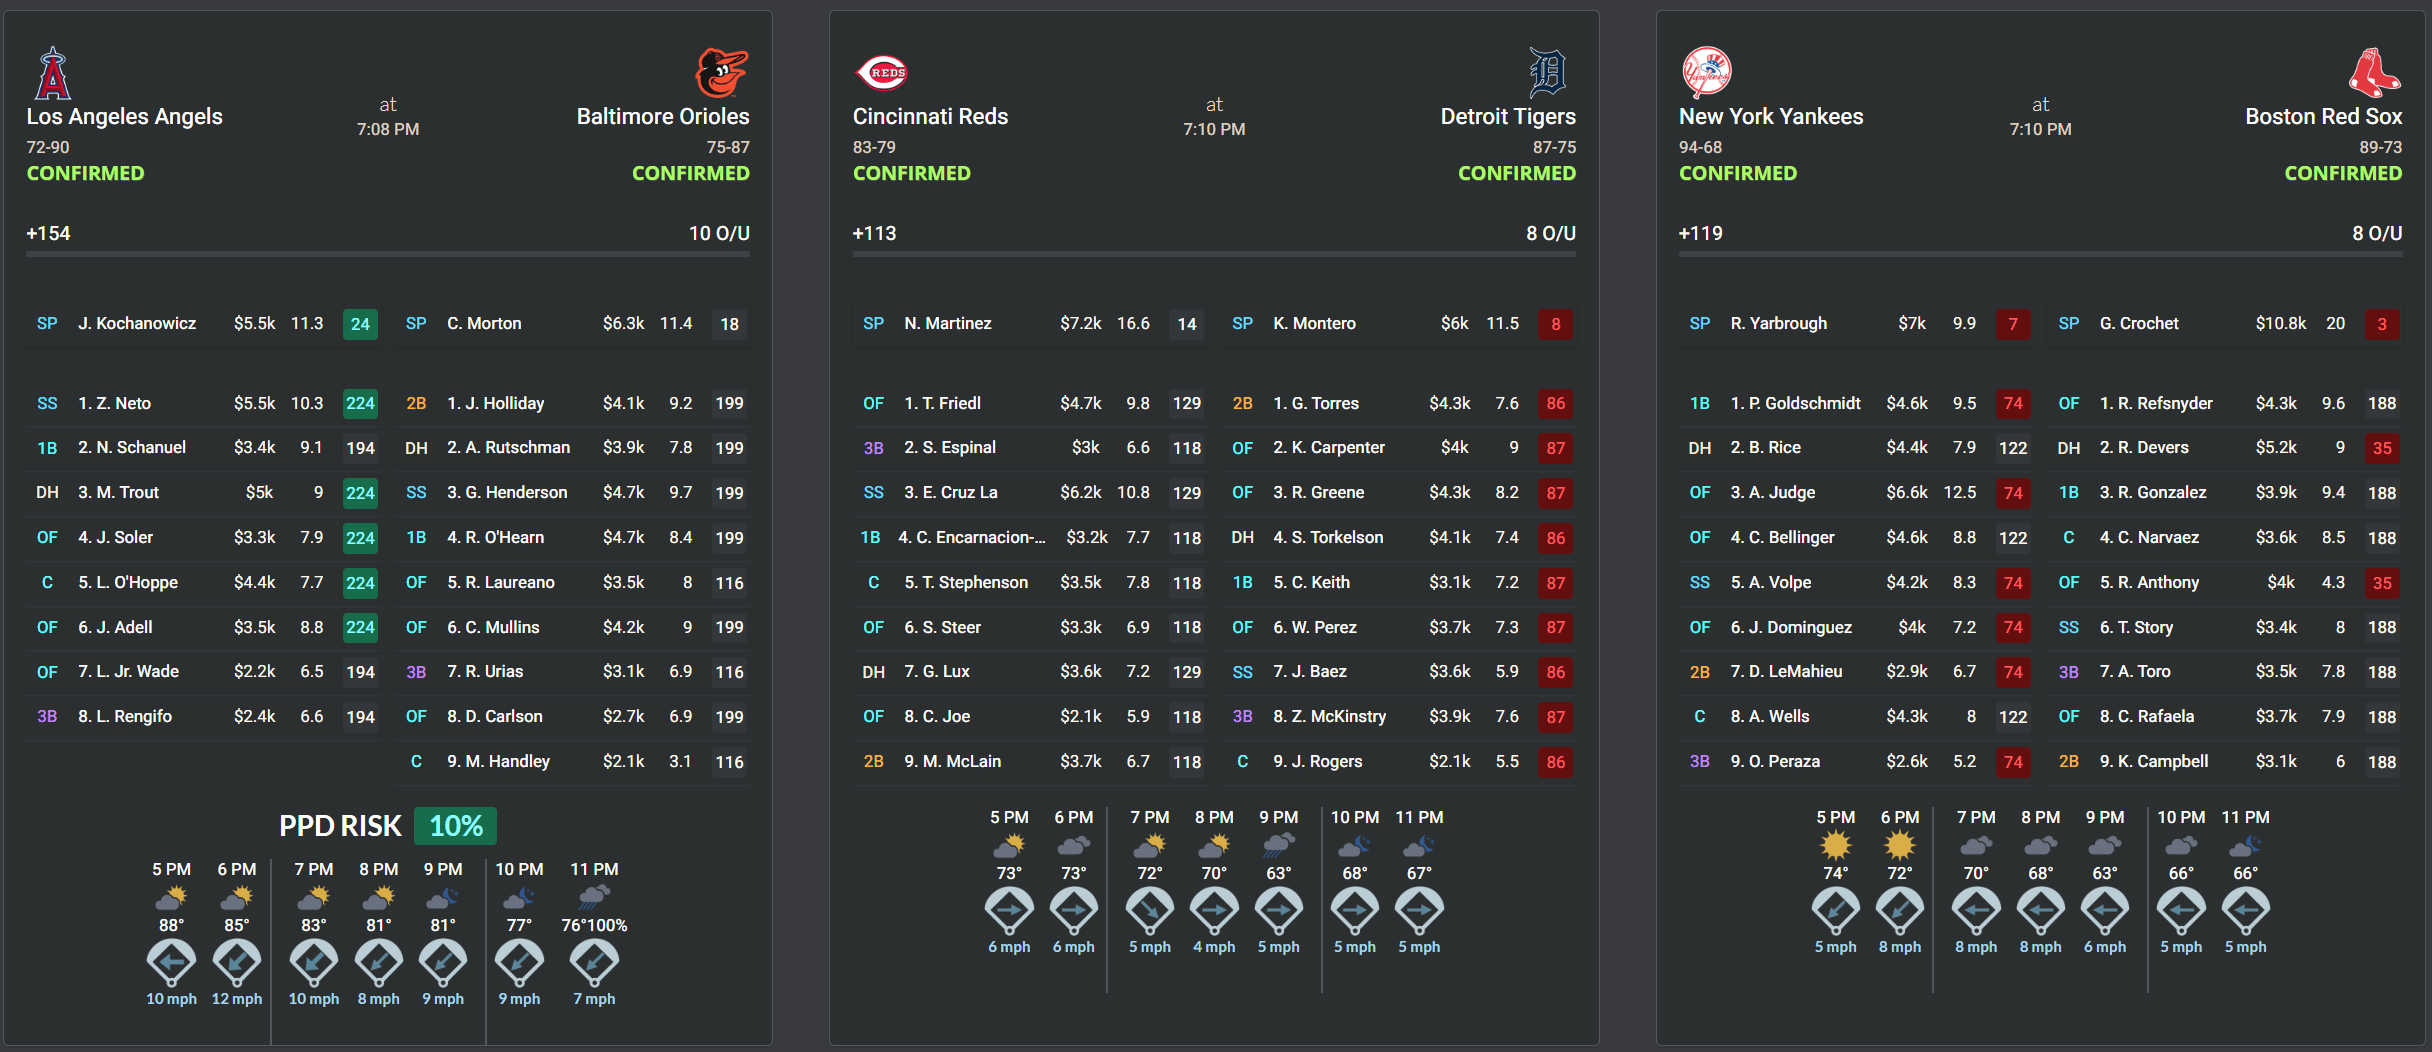
I’ll highlight the most important weather impacts in a dedicated section in my newsletters, but conditions can change between when I write my articles and when games start. For real-time updates, LineStar’s MLB Daily Dashboard provides hour-by-hour forecasts and postponement risk percentages at the bottom of every game’s lineup card.
🎯 Contest Selection
Before we get into the stats sections, one final topic worth covering – especially for GPP players – is contest selection. It’s easy to get drawn into massive tournaments with six-figure payouts and 150-max entries, but that’s not always the most optimal approach – particularly if you’re only playing one lineup or a small handful.
If you’re not entering dozens (or hundreds) of lineups, consider focusing on single-entry or three-entry max contests, where you’re on a much more level playing field. In large-field GPPs that allow 150 entries per user, you’re at a clear disadvantage if you’re only rolling out a few lineups.
Many DFS players also limit themselves to traditional GPPs without exploring alternative contest types like:
Quintuple-ups – 20% of the field wins 5x their buy-in
10x multipliers – A smaller percentage of players win 10x their buy-in
Winner-Take-Alls – Only 1st place gets paid (high risk, high reward)
Satellites – Win entries into higher-stakes contests for a fraction of the cost
If your preference is to take a single shot at the largest GPP of the day with a $100K top prize, go for it. Just understand that this approach isn’t ideal for long-term ROI.
Example of Contest Allocation ($100 Bankroll on DraftKings, 6+ Game Slate)
Cash Games Utilizing a Single Cash Lineup ($60 total):
✅ $25 Single-Entry Double-Up
✅ $10 Single-Entry Double-Up
✅ $5 Single-Entry Double-Up
✅ $10 Head-to-Head Contest
✅ $10 Triple-Up
GPPs ($40 total):
✅ $12 Single-Entry GPP
✅ $5 to max-enter a $0.25 GPP (20 lineups)
✅ $9 in a three-entry max $3 GPP (three lineups)
✅ $3 in a three-entry max $1 Winner-Take-All ($100 to 1st)
✅ $3 in three $1 Quintuple-Ups (often using my cash lineup)
✅ $8 for miscellaneous entries (e.g., a single bullet in an $8 GPP with top-heavy payouts or spread across low-dollar satellites)
This is just an example of how I might allocate contests on a typical slate, and it will vary from day to day. Some slates call for a more GPP-heavy approach, while others are better suited for cash games.
At the end of the day, play how you want and have fun – just understand that DFS comes with inherent risk. Managing your contest selection wisely can go a long way toward maximizing ROI and minimizing unnecessary variance.
🔍 Key Statistics & Research Tools for MLB DFS
Baseball, while simple at its core, has evolved into one of the most data-rich sports. With dozens of advanced stats and analytical metrics, it’s easy to get overwhelmed. But at the end of the day, baseball is still highly unpredictable, and no amount of data can fully eliminate the randomness that makes the game so exciting.
That said, leveraging key statistics can provide a crucial predictive edge in DFS, and sometimes that small edge is the difference between cashing and busting. Below, I’ll highlight the most important stats and research tools I use when building MLB DFS lineups, whether it’s for building a single bullet lineup or 100+ lineups. You’ll also see these metrics referenced frequently in my daily newsletters throughout the season.
Best Resources for MLB DFS Research (in addition to LineStar)
While LineStar does a fantastic job of highlighting the most relevant DFS stats, they can’t fit everything onto one screen without cluttering the interface and taking the focus away from the actual DFS aspect. If you’re looking to dive deeper into advanced data, splits, and trends, two free resources I highly recommend are:
FanGraphs – One of the most comprehensive baseball stat sites, great for advanced metrics, splits, and player trends.
Baseball Savant – Powered by Statcast, this site provides elite-level data like exit velocity, launch angle, barrel rates, and more. LineStar provides some of these Statcast data points as well, but Baseball Savant can show you a load of advanced metric information.
Both sites are much easier to navigate on a desktop or laptop computer than on a phone, and they can take some time to get comfortable with. But if you ever need help navigating FanGraphs or Baseball Savant, feel free to DM me on Twitter – I’m happy to help (and feel free to tag me if I miss your message).
By combining the data from these sources with LineStar’s tools, you’ll have everything you need to make well-informed, high-upside DFS decisions.
⚾ Key Pitching Info & Metrics
When building MLB DFS lineups, I almost always start with pitching before moving on to hitters and stacks. Pitchers generally carry less variance than hitters on a daily basis, making them the more stable foundation of a lineup.
Below are the key stats and metrics I rely on when narrowing down my pool of preferred pitchers.
These are the go-to stats I use to evaluate pitchers, and you’ll see them referenced often in my daily newsletters.
Vegas Totals & Moneyline Favorites
This one’s simple – if a pitcher is taking the mound for a team that’s a -250 favorite with an implied total under 3.5 runs against, that usually signals an excellent spot. These types of lines are typically reserved for elite aces, but even an above-average starter in a strong matchup – especially one backed by a solid offense – can land in the -150 to -180 range with an implied total under 4.5.
While Vegas lines shouldn’t be the only deciding factor, they’re a strong starting point for research. Sportsbooks use advanced models and massive data sets to shape these lines, so it’s smart to factor them in when evaluating pitchers.
kRate (Strikeout Percentage or K%)
Strikeouts are king in DFS scoring for pitchers, and you want arms with high K upside in your lineups. A pitcher can allow a few hits and runs and still be viable if he’s piling up strikeouts.
I also prefer kRate (K%) over K/9, as it provides a better measure of a pitcher’s dominance and efficiency.
Example:
Pitcher A: 7 IP, 7 H, 3 BB, 6 K
Pitcher B: 7 IP, 3 H, 1 BB, 6 K
Both pitchers have the same K/9, but when you factor in batters faced:
Pitcher A: Faced 31 batters → 19.4% kRate
Pitcher B: Faced 25 batters → 24% kRate
kRate shows that Pitcher B is more efficient at generating strikeouts, making him the stronger DFS target despite identical K/9 numbers.
Additionally, always check an opposing team’s kRate splits vs. RHP/LHP. Even a low-strikeout pitcher can see a meaningful boost when facing a lineup that tends to whiff versus said pitcher’s handedness.
Among qualified SPs, AL Cy Young winner Tarik Skubal was the kRate king in 2025 with a 32.2% K%
xFIP (Expected Field Independent Pitching)
xFIP is an advanced metric that builds on FIP (Field Independent Pitching) to provide a more predictive view of a pitcher’s future ERA. Traditional ERA can be misleading, as it doesn’t always reflect a pitcher’s true skill level. xFIP helps by attempting to remove luck and randomness, particularly factors like home run variance.
When a pitcher’s xFIP differs significantly from his ERA – especially early in the season – it can offer valuable insight into whether that pitcher may be overvalued or undervalued.
Example:
Pitcher A: ERA = 3.20, xFIP = 4.80
Likely benefiting from favorable variance (e.g., balls in play not finding holes) and could be due for regression
Potentially overvalued in DFS
Pitcher B: ERA = 4.15, xFIP = 3.30
Likely pitching better than his ERA suggests
Could be undervalued and a strong buy-low candidate
League average xFIP typically sits around 3.90.
Below 3.20 – Excellent
Above 4.30 – Poor
WHIP (Walks plus Hits per Inning Pitched)
A pitcher’s primary job is to limit runs, which usually comes down to preventing base runners. That’s where WHIP (Walks plus Hits per Inning Pitched) comes into play.
While WHIP is a solid metric, it doesn’t tell the full story, as it treats all base runners equally – a walk counts the same as a home run, which isn’t always an ideal comparison. Still, it’s a reliable starting point when evaluating pitchers on any given slate.
An average pitcher’s WHIP typically sits around 1.30.
1.10 or lower – Elite
Above 1.60 – Poor and a potential red flag
SwStr% (Swinging Strike Percentage)
SwStr% is calculated by taking a pitcher’s total swings and misses and dividing that by the total number of pitches thrown. It’s a valuable metric because it helps show how often a pitcher is generating whiffs, and whether their kRate is overperforming or underperforming.
A good rule of thumb – doubling a pitcher’s SwStr% can provide a rough estimate of their expected kRate.
League average SwStr% sits around 10%.
Above 13% – Elite
Below 8.5% – Poor
CSW% (Called + Swinging Strike Percentage)
CSW% is a more recent metric that combines Swinging Strike Percentage (SwStr%) with Called Strike Percentage (CStr%). Simply put, it’s the sum of the two and provides a clear picture of a pitcher’s ability to control the strike zone while also generating whiffs.
A high CSW% typically signals a pitcher who is both difficult to hit and efficient in getting ahead in counts, which is exactly what we’re looking for in DFS.
Around 30% or higher – Strong / highly desirable for DFS
Home/Road Splits
Home/road splits are an important factor when evaluating pitchers, as some perform noticeably better in one setting than the other. Some thrive with the comfort and familiarity of pitching at home, while others may struggle on the road, where routine and environment can impact performance.
Park factors also play a major role. Pitcher-friendly parks (e.g., T-Mobile Park, Oracle Park) can boost a pitcher’s home splits, while hitter-friendly environments (e.g., Coors Field, Fenway Park) can work against them.
Always factor in both pitcher tendencies and ballpark context when making your decisions.
Secondary Pitching Stats & Info
While the following stats aren't always the first thing I look at, they can help when digging deeper into pitcher evaluations for a specific slate.
SIERA (Skill-Interactive ERA)
While xFIP focuses on strikeouts, walks, and home runs, SIERA expands further by incorporating balls in play, helping explain why some pitchers are more effective at limiting hits and run production.
SIERA is widely viewed as a highly predictive metric of overall pitching performance, and it tends to correlate well with strikeout ability and run prevention.
League average SIERA typically sits around 3.90.
Below 3.25 – Excellent
Above 4.50 – Poor
GB% (Ground Ball %), FB% (Fly Ball %), LD% (Line Drive %)
These metrics help define the type of pitcher you’re dealing with. While not every arm fits neatly into one category, many lean toward either a ground ball or fly ball profile. Line drives are also important to monitor, as they result in hits at a much higher rate than ground balls or fly balls.
GB% (Ground Ball %)
League average: ~44%
50% or higher – Ground ball pitcher
FB% (Fly Ball %)
League average: ~35%
Around 40% or higher – Fly ball pitcher
LD% (Line Drive %)
League average: ~20%
Elevated LD% – Can signal a pitcher who is struggling or allowing consistent hard contact
Additionally, when evaluating fly ball pitchers, pay attention to Hard% (hard-hit rate). A fly ball pitcher with a Hard% near or above 40% is far more likely to give up home runs – something to target when building stacks around power hitters.
Jose Soriano forced an MLB-leading 65.3% GroundBall% in 2025.
Soft%, Med%, Hard% (Soft/Medium/Hard Contact Rate)
Soft%, Med%, and Hard% measure the quality of contact a pitcher allows, breaking down batted balls by how hard they’re hit. These metrics are derived from Baseball Info Solutions (BIS) data, based on factors like hang time, location, and trajectory.
Soft contact – Generally a positive for pitchers, as it leads to weakly hit balls and lower hit probability
Hard contact – A red flag, as it increases the likelihood of extra-base hits and home runs
Key thresholds:
Soft%: 20% or higher – Elite
Hard%: 35% or higher – Poor
The goal is simple – generate more soft contact while limiting hard contact. Identifying pitchers who consistently induce weak contact can provide a meaningful edge when building DFS lineups.
HR/FB Rate (Home Run to Fly Ball Rate) & HR/9 (Home Runs Allowed Per 9 Innings Pitched)
A pitcher’s DFS output can unravel quickly if they give up home runs, especially multi-run shots. Two key stats that help evaluate home run risk are HR/FB Rate and HR/9.
HR/FB Rate – Percentage of fly balls that result in home runs
HR/9 – Number of home runs allowed per nine innings pitched
Key thresholds:
HR/FB Rate:
10-11% – League average
Around 8% or below – Excellent
Above 13% – Poor (elevated home run risk)
HR/9:
Below 1.00 – Strong
Above 1.50 – Risky, especially against power-heavy lineups
Once a pitcher’s HR/9 starts creeping above 1.50, they become a viable target for opposing power hitters – particularly in hitter-friendly parks or favorable hitting conditions (heat, humidity, or wind blowing out).

Pirates’ ace Paul Skenes led all qualified starters with a 0.53 HR/9 Rate in 2025.
⚾ Key Batting Info & Metrics
As mentioned earlier, no matter how hot a hitter is or how much salary you’re paying for them, there’s always a chance they go 0-for-4 and leave you with a goose egg. That’s just baseball – and an unavoidable part of MLB DFS.
That said, by focusing on the right stats and trends, you can improve your odds and make more informed decisions when building both team stacks and one-off hitters.
Note: Many of the pitching stats discussed earlier can also help identify struggling pitchers to target with hitters and stacks, and vice versa – hitting metrics can help pinpoint struggling offenses to attack when building your pitcher player pool.
Example: If a team has a 28% kRate and a sub-.300 wOBA against right-handed pitching over the last month, it’s a strong signal to consider rostering the opposing RHP in DFS lineups.
Primary Batting Stats & Info
These are the key metrics I rely on most when identifying strong stacks and one-off hitters. You’ll often see these referenced in the daily newsletters.
Vegas Implied Run Total
This is as straightforward as it gets – teams projected for 5.0+ runs typically carry a strong offensive outlook. In especially favorable spots, that number can climb to 6.0+ runs.
Coors Field is the most obvious example. Games in Colorado frequently produce implied totals pushing 7.0+ runs, particularly in warmer weather during the late spring and summer.
Ballpark/Weather Factor
As mentioned earlier, ballpark factors and weather conditions are critical when evaluating hitters and stacks. If a team is playing in a hitter-friendly park or has favorable conditions (hot, humid weather or winds blowing out), they become a strong target – even against solid pitching.
If you’re looking for a deeper breakdown, you can check out rankings of the most and least hitter-friendly parks from last season by clicking this link.
wOBA (Weighted On-Base Average)
wOBA is one of the best all-in-one offensive metrics. Unlike batting average, which treats all hits equally, wOBA assigns proper value to each outcome (singles, doubles, triples, home runs, and walks) based on their actual contribution to run scoring.
This is one of my go-to stats when identifying cash-game hitters with a strong offensive profile.
Key benchmarks:
League average: ~.320
Elite hitters: .400+
Poor hitters: .290 or below
wOBA provides a more complete picture of a hitter’s overall offensive production, making it one of the most reliable and widely used stats in MLB DFS.
wRC+ (Weighted Runs Created Plus)
wRC+ is an excellent stat for measuring a hitter’s overall offensive value relative to league average. It adjusts for park factors and league run environments, giving you a clearer, context-neutral view of performance.
Key benchmarks:
100 – Always represents league average
140 – Producing 40% above league average
160+ – Elite hitters
90 or below – Poor or struggling hitters
I love wRC+ because it’s easy to interpret and highly reliable. Whether you’re identifying top-tier bats or uncovering value, it’s one of the best indicators of how impactful a hitter truly is.

Yankees superstar Aaron Judge led all MLB hitters with a mammoth 204 wRC+ in 2025, producing more than twice the offensive value of an average big league hitter.
ISO (Isolated Power)
ISO is a straightforward stat that measures a hitter’s raw power and extra-base hit ability. It’s especially useful for GPP builds, as it helps identify players with home run and extra-base upside.
Example (over ~1 week / 25 ABs):
Player A: 25 AB, 10 H, 9 Singles, 1 Double, 0 HR
Player B: 25 AB, 6 H, 2 Singles, 1 Double, 3 HR
Player A: .400 AVG, .440 SLG, .040 ISO
Player B: .240 AVG, .680 SLG, .440 ISO
In this example, Player A has strong contact and batting average but limited power, making him more suited for cash formats. Player B, despite a lower average, brings significantly more upside due to his power profile – making him the more appealing GPP target.
Key benchmarks:
.250+ – Elite power
~.140 – League average
.100 or below – Low power
Splits vs. RHPs/LHPs
In general, hitters perform better with the platoon advantage – right-handed batters vs. left-handed pitchers and left-handed batters vs. right-handed pitchers. This is largely due to how hitters track pitches breaking toward or away from them, which impacts both contact quality and pitch recognition.
That said, some players show reverse splits, meaning they actually perform better against pitchers of the same handedness.
Switch hitters are also worth noting, as many are stronger from one side of the plate, even though they technically always have the platoon advantage.
When building stacks, it’s common to lean into one side of the plate if the matchup is strong enough to justify it. Just be aware of the tradeoff – if the starting pitcher exits early, you could run into less favorable bullpen matchups later in the game.
That said, if your stack is the reason the starter gets pulled early, you’ve likely already captured a good portion of the upside.
2025 AL ROTY Nick Kurtz (LHB) was a MONSTER versus RHPs (.336 AVG, .477 wOBA, 1.153 OPS, 211 wRC+) but his splits took a major hit versus LHPs (.197 AVG, .292 wOBA, .685 OPS, 83 wRC+).
Home/Road Splits
Just as pitchers can show meaningful home/road splits, hitters can as well. While park factors play a major role, many hitters still perform better at home due to familiarity, comfort, and routine – even in pitcher-friendly environments.
Understanding how a hitter performs in different settings can provide a useful edge when making DFS decisions, especially when weighing similar options.
OPS (On-Base Plus Slugging)
OPS combines a player’s On-Base Percentage (OBP) and Slugging Percentage (SLG) into a single metric that measures overall offensive production. It’s a strong all-in-one stat because it captures both a hitter’s ability to reach base and hit for power.
OBP – How often a batter reaches base (hits, walks, and hit-by-pitches)
SLG – Measures power by calculating total bases per at-bat
OPS is commonly used as a quick, comprehensive gauge of a hitter’s performance. A high OPS indicates success in both areas, while a low OPS suggests struggles in one or both.
Key benchmarks:
.900+ – Elite
.800+ – Above average
~.750 – League average
Below .700 – Poor
If you think back to school grading, OPS can be viewed in a similar way. A 1.000 OPS (or a 100 on a test) grades out as an A+, and anything above that is rare territory. Around .850 OPS is a solid B, while anything below .700 starts to fall into D/F range.
Shohei Ohtani cleared the 1.000 OPS mark in 2025 (1.014) – a rare feat over a full season and a sign of true offensive dominance.
Secondary Batting Stats & Info
While the following stats are not referenced as often in daily newsletters, they still provide valuable insights into specific slates and can help deepen your overall analysis.
HardHit% (Hard-hit Rate)
HardHit% is a key stat I semi-regularly reference, as it helps measure a hitter’s quality of contact and raw power. It’s similar in concept to ISO, but instead of results, it focuses on how hard the ball is being hit.
A batted ball is considered “hard-hit” when its exit velocity is 95+ MPH – a threshold strongly associated with higher batting averages and extra-base hit potential. Historically, hard-hit balls produce a .500+ batting average and .600+ wOBA.
Key benchmarks:
Above 50% – Elite
Around 40% – League average
Below 30% – Poor
Barrel% (Barrel Rate)
Barrel% has emerged as one of the most important power metrics in baseball, as it measures how often a hitter makes ideal contact. A “barrel” is a batted ball with the optimal combination of exit velocity and launch angle, which typically results in extra-base hits and home runs.
In simple terms – barrels are the types of contact that do the most damage.
This stat is extremely useful for identifying hitters with true home run upside, making it especially valuable for GPP builds. While HardHit% tells us how often a ball is hit hard, Barrel% tells us how often it’s hit perfectly.
Key benchmarks:
12%+ – Elite power
~7–8% – League average
Below 5% – Low power / limited upside
Hitters with consistently high Barrel% rates are strong candidates for home runs and big fantasy performances, even if their recent box scores don’t fully reflect it.
“The Big Dumper” Cal Raleigh posted a massive 19.5% Barrel% in 2025 (4th in MLB), powering his league-leading 60 HR season and setting a new single-season home run record for a catcher.
Exit Velocity (EV)
Exit velocity measures how hard a ball is hit off the bat. While stats like HardHit% and Barrel% track this over time, raw EV is useful for identifying recent form and contact quality on a game-to-game or week-to-week basis.
In DFS, I often reference EV to spot hitters who are seeing the ball well, even if the results haven’t fully shown up yet.
General benchmarks:
95+ MPH – Hard-hit ball
100+ MPH – Strong contact
105+ MPH – Elite contact / home run-level power
Consistently high exit velocities – especially in recent games – can signal a hitter who is due for positive regression and worth targeting in both cash games and GPPs. LineStar also highlights this in its Statcast section, showing each hitter’s average exit velocity over the last two weeks.
BABIP (Batting Average on Balls in Play)
BABIP measures how often a ball in play results in a hit, excluding home runs, walks, and strikeouts. League average BABIP typically sits around .300, but a player’s individual BABIP can fluctuate based on luck, defense, and quality of contact.
Example: If a player has a career BABIP of .330 but starts the season at .270, it can signal they’ve been unlucky or running cold, and may be due for positive regression over time.
That said, not all BABIP swings are purely luck-driven – hitters with strong contact quality (HardHit%, line drives, speed) can sustain higher-than-average BABIPs.
Key benchmarks:
.350+ – Very high (often unsustainable without elite contact/speed)
~.300 – League average
.260 or below – Low (potential negative variance or weak contact)
Opposing Bullpen Strength
In MLB DFS, opposing bullpen strength is often overlooked, but it’s an important factor when evaluating matchups. While most players focus on the starting pitcher, a significant portion of the game is still played against the bullpen – often accounting for a third or more of a team’s plate appearances.
Weak bullpens – Provide additional opportunities for late-inning offense, especially for stacks. If the starter exits early, hitters may see multiple innings against subpar pitching.
Strong bullpens – Can limit upside in the later innings, making it harder for stacks to fully capitalize even if they get to the starter early.
Key considerations:
Pitching strategy – Some teams use an “opener + bullpen” approach, where multiple relievers cover the bulk of the game. In these spots, platoon splits can matter less, and overall bullpen quality becomes more important.
Bullpen workload – A taxed bullpen (heavy usage over the last few days) is more prone to giving up runs, while a well-rested unit is typically more effective.
Game flow upside – If a starter is expected to struggle or has a short leash, hitters may get extended exposure to weaker relievers, increasing overall ceiling.
Example:
If a team is facing an above average starter backed by a weak bullpen, it can create an appealing GPP stacking opportunity – especially if the starter exits early. On the flip side, facing a dominant bullpen can cap upside, even if the matchup versus the starting pitcher is promising.
Factoring in bullpen strength can give you an edge, particularly in GPPs, where late-inning upside and lower-owned stack paths can make a big difference.
The 2025 Padres bullpen ranked top-three in ERA, xFIP, kRate, WHIP, SIERA, and HardHit% – late game offensive rallies were difficult to come by against them.
💭 Final Thoughts
If you’ve made it this far, I appreciate you sticking with me. I know this is a lot to take in, but everything covered here is meant to give you a clearer path when approaching MLB DFS.
There’s no shortage of data, metrics, and strategies in baseball, and it can feel overwhelming at times – especially if you’re newer to the sport. But don’t feel like you need to master everything at once. Focus on the core concepts, stay consistent with your process, and build from there.
At the end of the day, baseball is still a volatile game. There’s no perfect formula, and even the best plays will fail from time to time. The goal is simply to put yourself in the best possible position over the long run by using the information available to gain an edge.
Appreciate you taking the time to read through this guide, and best of luck this season. Let’s have some fun – and hopefully make some money along the way!